Name
Lab Partners
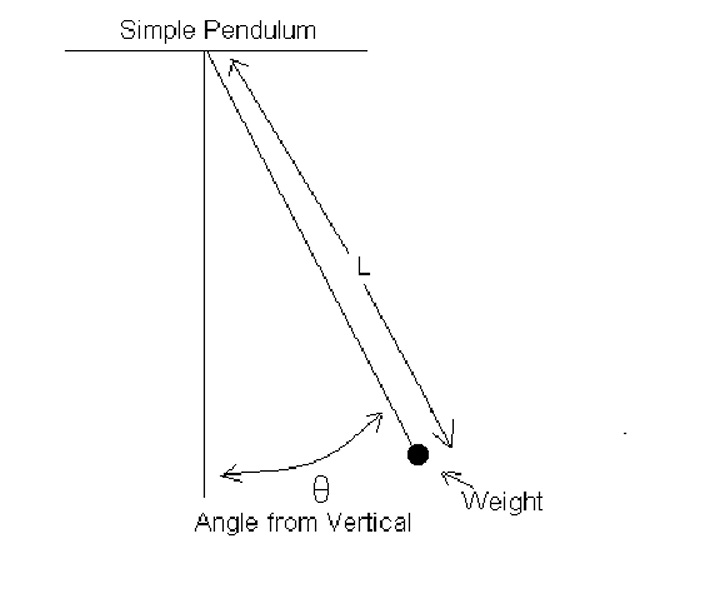
Purpose : To investigate the relationship between the length of a simple
pendulum and the time it takes to complete a full swing.
Equipment : String, stop watch, weights, meter stick, protractor, ( a balance if available).
General Procedure : Tie one of the weights to the end of the
string. From the center of the weight measure off the specified length
of the string. Holding the string at this distance, let the lead weight
swing freely from an initial position that makes a 20° angle (Theta)
with the vertical . Measure the time for 10 full swings of the weight.
Divide this time by 10 to obtain the period T , the time
for one full swing. Repeat this procedure for each of the specified values
of L .Then repeat the experiment for Theta=25°
and Theta=30° . Finally, pick a second, different mass weight
and repeat the entire set of measurements.
Click here to see an illustration of the motion of a simple pendulum.
Give a brief but accurate description of the procedure you followed
in obtaining your data. Use diagrams where necessary and identify all pertinent
variables.
I. Data Collection (20 points)
Data Table for First Weight ( If Balance available mass of weight
= )
L |
Theta=20° | Theta=25° | Theta=30° | |||
| Time for 10 Swings | Period T | Time for 10 Swings | Period T | Time for 10 Swings | Period T | |
| 10.0 cm | ||||||
| 15.0 cm | ||||||
| 20.0 cm | ||||||
| 25.0 cm | ||||||
| 30.0 cm | ||||||
| 35.0 cm | ||||||
| 40.0 cm | ||||||
| 45.0 cm | ||||||
| 55.0 cm | ||||||
| 60.0 cm | ||||||
| 65.0 cm | ||||||
| 70.0 cm | ||||||
| 75.0 cm | ||||||
| 80.0 cm | ||||||
Data Table for Second Weight ( If Balance available mass
of weight = )
L |
Theta=20° | Theta=25° | Theta=30° | |||
| Time for 10 Swings | Period T | Time for 10 Swings | Period T | Time for 10 Swings | Period T | |
| 10.0 cm | ||||||
| 15.0 cm | ||||||
| 20.0 cm | ||||||
| 25.0 cm | ||||||
| 30.0 cm | ||||||
| 35.0 cm | ||||||
| 40.0 cm | ||||||
| 45.0 cm | ||||||
| 55.0 cm | ||||||
| 60.0 cm | ||||||
| 65.0 cm | ||||||
| 70.0 cm | ||||||
| 75.0 cm | ||||||
| 80.0 cm | ||||||
II. Data Analysis (20 points)
What were the relevant variables in this experiment?
Which variables were independent and which were dependent?
Construct a graph of T versus L . Label all axes and label each curve as to the weight and angle used. You may if you wish put all six curves on the same graph. You may use either the grid provided or your own graph paper.
Graphs of T versus L

In general, how did the period depend on the initial angle ?
In general, how did the period depend on the weight used ?
Construct a graph of ln(T) versus ln(L)
.Label all axes and label each curve as to the weight and angle used. You
may if you wish put all six curves on the same graph. You may use either
the grid provided or your own graph paper. Record the data for these graphs
in the table provided.
Data Table for ln(T) vs ln(L)
L |
ln(L) |
First weight | Second Weight | ||||
| 20° | 25° | 30° | 20° | 25° | 30° | ||
| ln(T) | ln(T) | ln(T) | ln(T) | ln(T) | ln(T) | ||
| 10.0 cm | |||||||
| 15.0 cm | |||||||
| 20.0 cm | |||||||
| 25.0 cm | |||||||
| 30.0 cm | |||||||
| 35.0 cm | |||||||
| 40.0 cm | |||||||
| 45.0 cm | |||||||
| 55.0 cm | |||||||
| 60.0 cm | |||||||
| 65.0 cm | |||||||
| 70.0 cm | |||||||
| 75.0 cm | |||||||
| 80.0 cm | |||||||
Graphs of ln(T) versus ln(L)
III. Interpretation (20 points)
Is the relationship between and linear? Explain your answer.
Is the relationship between ln(T) and ln(L)
linear? Explain your answer.
From elementary physics the period of a simple pendulum for small initial
angles satisfies a 'power law' relationship to the length. That is T=L^p.
Where p is a constant independent of L. From
your data obtain an estimate of p . Explain how you obtained
this estimate.
Estimated value of p =
For the same weight you used estimate the period if 100 cm . If you
have the equipment you may wish to check this estimate by actually measuring
the period.
Estimated period for a length of 100 cm =
IV. Application (12 points)
Below is a table of data on the electrical resistance, R
, for a 1 meter length of different gauge copper wire. The wire's diameter
is d.
Copper Wire Resistance Data
| Gauge | d (cm) | R (milliohms) |
| 30 | 0.03175 | 223.7 |
| 25 | 0.05556 | 73.0 |
| 20 | 0.09525 | 24.9 |
| 15 | 0.1786 | 7.1 |
| 12 | 0.2778 | 2.9 |
| 10 | 0.3572 | 1.8 |
| 9 | 0.3969 | 1.4 |
| 8 | 0.4366 | 1.2 |
| 7 | 0.4763 | 1.0 |
| 6 | 0.5159 | 0.8 |
| 5 | 0.5556 | 0.7 |
| 4 | 0.5953 | 0.6 |
According to theory the resistance is related to diameter by a 'power
law' . That is R=d^p , where p is a constant
independent of d . From the table obtain an estimate of p
. Explain how you obtained this estimate.
Estimated value of p =
Estimate the resistance for a 1 meter length of 35 gauge (d=0.01984
cm) copper wire.
Estimated resistance for a 1 m length of 35 gauge copper wire =