 |
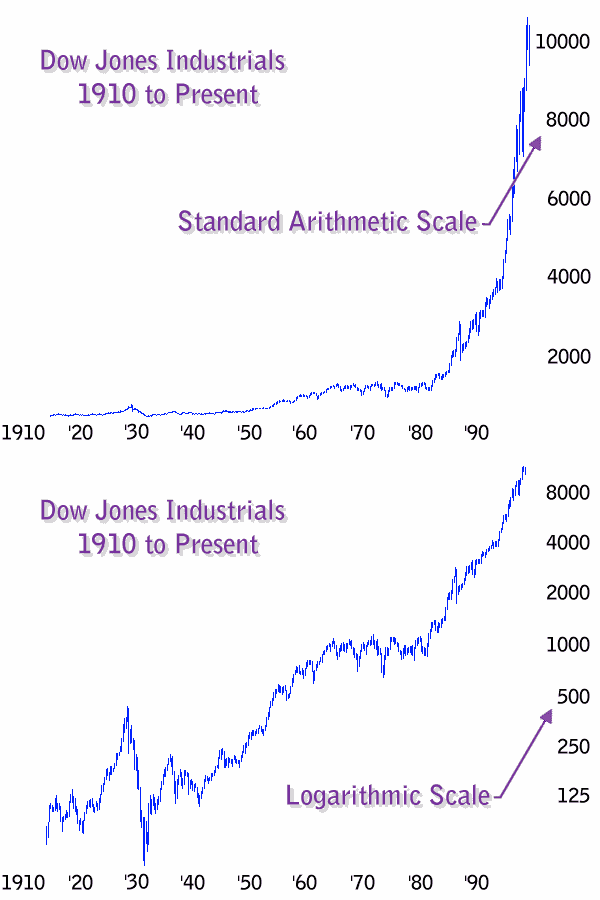
| Chart reading is often more art than science; but there are definite, quantifiable aspects of charting that are very important. The most basic attribute of chart creation is in the choice of scales used to represent the data. As you can see in the two charts below, as they toggle back and forth, there is a significant difference in appearance between the two. These two charts are actually constructed from the same data. |
 |
| Arithmetic scaling measures an equal amount of numerical change. |
| The difference in appearance is due to the scaling of the vertical axis, which is listed on the right side of the chart. The standard scaling used on most charts is arithmetic (pronounced: ar-ith-'met-ic, rather than a-'rith-me-tic). It is based on the units of the chart axis have equal spacing. The measurements of a ruler or tape measure are a common example. In the Arithmetic Chart above, the spacing between the numbers of the vertical axis is equal to 2000 points of the Dow Jones Industrial Average. |
| Logarithmic scaling measures an equal amount of percentage change. |
| The term "semi-logarithmic" refers to one axis being arithmetic and one axis being logarithmic. In stock market charting, the x axis (horizontal) measures the amount of time. This measurement demands the use of arithmetic scaling since every unit of time (day, week, month, year, etc.) is equal in length. The y axis (vertical) measures the amount of change in stock price or market index. In the Semi-Logarithmic Chart above, each space on the y axis measures a 100% increase in the units measured (Ex: 125, 250, 500, 1000, 2000 etc.).
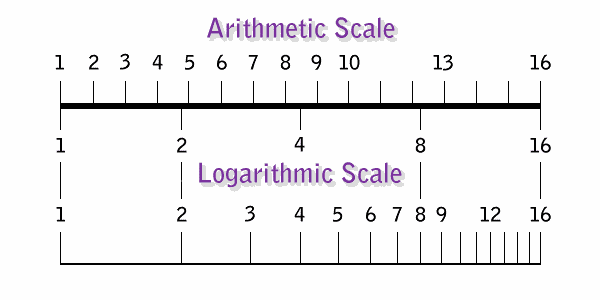
Logarithmic scales represent an equal amount of percentage change. Arithmetic scales represent an equal amount of numerical change.
In reviewing the figure below, consider how a one point change in a $10 stock is vastly greater than a one point change in a $100 stock and how a 50 point increase in the Dow Jones today, is considerably less important than it was, just a few years ago. Using the Logarithmic Scale, notice that the spaces between 1, 2, 4, 8, and 16 are equal. Each space measures a 100% increase because logarithmic units measure equal percentage change. |
 |
| Valid comparisons can only be made with units of percentage change; that is, logarithmic. |
| Charts produced by the media can be a disadvantage for the individual investor. |
| The concept of measuring percentage change is extremely important in all areas of finance. It is routinely used for stating expectations and reporting results. However, the reporting of historical stock prices in graphical format using "units of percentage change" has been, for the most part, neglected by the media. The examples above clearly demonstrate how deceptive charts can be. |
| Conclusion: Semi-logarithmic charting is required for identifying long term trends. |
| Trend Identification with Semi-Log Charts |
| History Dynamics Analytics Home |
Copyright © 2001 BoomOnWallSt.com All Rights Reserved |