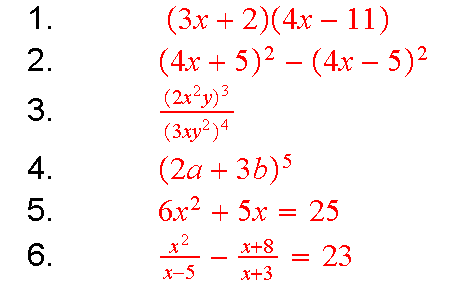
Enter these six algebraic expressions and perform the indicated operations.

Expand Expression 1.
Simplify Expression 2.
Simplify Expression 3.
Expand Expression 4.
Solve Expression 5.
Solve Expression 6
Take the answers to Expression 6 that involve square roots and approximate
them as decimal numbers with 16 places.
Make a 2D graph of ![]() for
x between -6.28 to 6.28 . Double click on this graph
and copy it to the clipboard. Open MS Paint, paste in the graph and save
to your floppy disk as a gif image. Return to Scientific Notebook.
for
x between -6.28 to 6.28 . Double click on this graph
and copy it to the clipboard. Open MS Paint, paste in the graph and save
to your floppy disk as a gif image. Return to Scientific Notebook.
Make a 3D graph of  for
x
and y both between -3 to 3 . Double click on
this graph and copy it to the clipboard. Open MS Paint, paste in the graph
and save to your floppy disk as a gif image. Return to Scientific Notebook
and print this worksheet.
2. Using the information found in the online tutorial at ftp://www.madison.tec.wi.us/alehnen/winptut/winpltut.htm, use WinPlot to do the following:
Make a 2D graph of ![]() for
x between -6.28 to 6.28 . Use the File menu to copy this
graph to the clipboard. Open MS Paint, paste in the graph and save to your
floppy disk as a gif image. Return to WinPlot and print this graph from
the File menu.
for
x between -6.28 to 6.28 . Use the File menu to copy this
graph to the clipboard. Open MS Paint, paste in the graph and save to your
floppy disk as a gif image. Return to WinPlot and print this graph from
the File menu.
Make a 3D graph of  for
x
and y both between -3 to 3 . Use the File menu
to copy this graph to the clipboard. Open MS Paint, paste in the graph
and save to your floppy disk as a gif image. Return to WinPlot and by rotating
the figure make a second copy of this image showing a different perspective
view. Again use the File menu to copy this graph to the clipboard. Open
MS Paint, paste in this new graph and save to your floppy disk as a new
gif image. Return to WinPlot and print this last graph from the File menu.
3. Open MS Word and using the Insert P icture From File command sequence import the five images saved to the A drive in parts 1 and 4 into your document. After each graphic has been brought into your document select it and Insert a caption. Print this MS Word document.
4. Hand in all four printouts attached to the title page.