 |
| Long term growth trends are often easily identified when using semi-logarithmic charts. |
| Examples of trend identification are found below. |
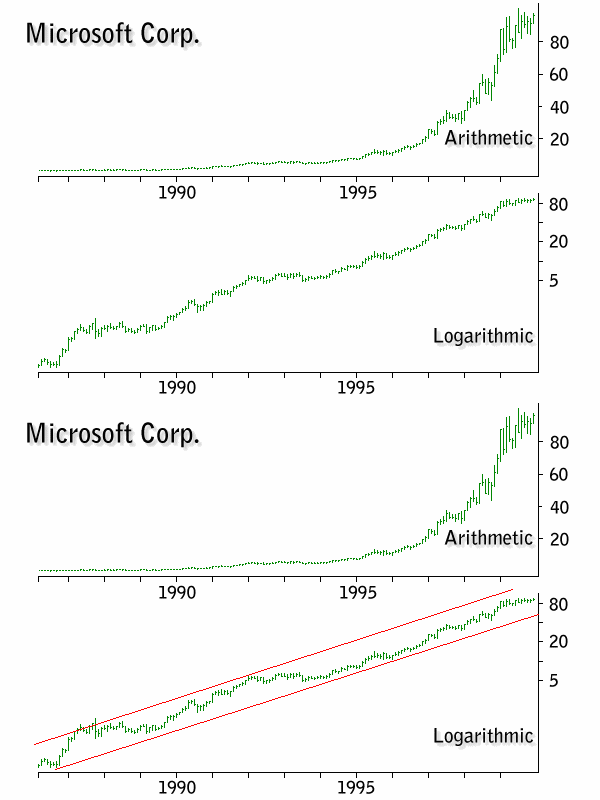
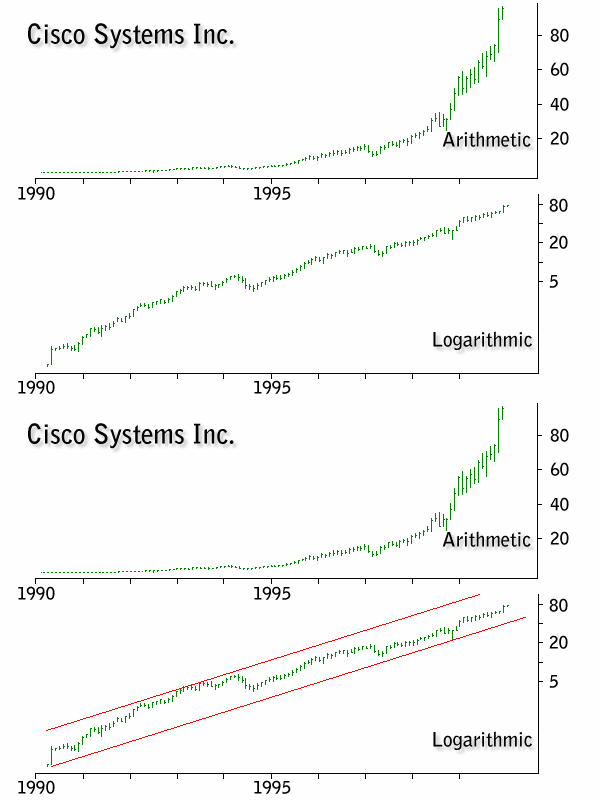
| Comparisons with arithmetic vs. logarithmic scaling are used to demonstrate the necessity of using semi-logarithmic charts for the identification of long term growth trends. |
 |
| A fifteen year growth pattern in Microsoft is reflected in a consistent up trend of the stock price. |
 |
| A ten year growth pattern for Cisco Systems. |
| Drawing parallel boundaries to contain the trend helps to quantify the level of risk for that particular stock. If the stock is purchased while it is near the top of the channel, it has a greater risk of retreating to lower levels. Likewise, if a stock is near the lower ranges of the channel, it has a greater potential to rise in price. Be cautioned, however, that this type of analysis must take into account the possibility of the long term trend coming to an end; that is, a major change occurring within the fundamental story of the particular company or industry. Trend analysis of price history should not be performed in a vacuum. Trends, of any duration, may come to an end without warning. The investor must always pay attention to news releases about the company, competitors, industry, or the economy, at large. |
| Semi-Logarithmic Charts -- Basics |
| History Dynamics Analytics Home |
Copyright © 2001 BoomOnWallSt.com All Rights Reserved |